Linux 下使用 gperftools
常用的性能分析工具有很多,比如 gprof,perf 等等。然而,它们似乎对 GCC 更友好。如果想要对 LLVM 编译出来的程序做分析,推荐 Google 的性能分析工具,Google gperftools。
凭借官方只言片语的解释,安装使用 gperftools 还是有点困难的:
https://gperftools.github.io/gperftools/cpuprofile.html
https://github.com/gperftools/gperftools
安装
sudo apt-get install libunwind-dev
sudo apt-get install google-perftools libgoogle-perftools-dev
推荐安装一款可视化软件,方便查看性能分析结果:
sudo apt-get install kcachegrind
使用
编写测试程序的时候,注意需要让程序有一定的运行时间。由于 gperftools 是通过采样来做分析的,如果程序太短很快就退出了,就不会有输出结果。
之后,在用 Clang 编译的时候,链接上 gperftools 的库:
clang test.c -lprofiler -o test
这样,性能分析的代码就已经注入到程序里了。运行时,要指定输出文件路径:
env CPUPROFILE=./test.prof ./test
这样,输出文件会存放在当前目录下的 test.prof 文件中。
可以通过 pprof 工具来查看:
google-pprof -text test test.prof
如果要使用刚刚所说的可视化工具,要先把输出文件转换成该工具支持的类型:
google-pprof --callgrind /usr/bin/python ./test.prof > ./test.txt
然后再用 kcachegrind 工具打开:
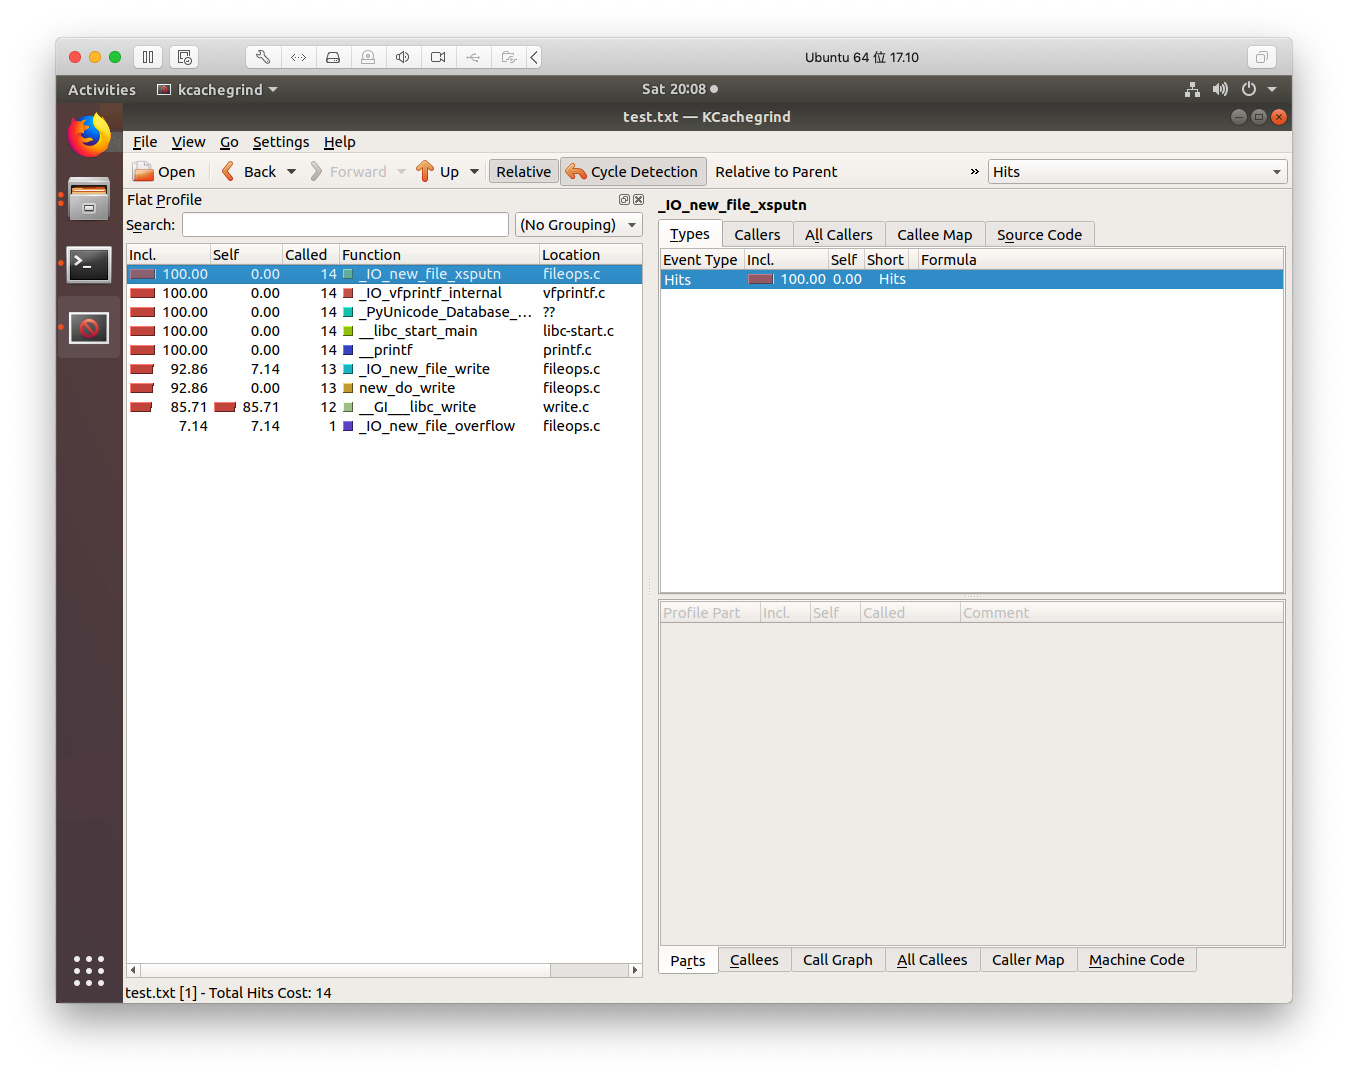
kcachegrind test.txt
截图如下:
当然,Google gproftools 是非常强大的工具,还有更多的功能值得探索。