Custom Plot Tensorboard
Tensorboard 是一款非常好用的深度学习可视化工具,而且它并不依赖 TensorFlow 本身。这样即使项目使用的是 PyTorch,也仍然可以用 Tensorboard 来记录日志。在撰写论文或报告的时候,我们有时候会想绘制一个 Loss 变化的曲线图。这个时候就不得不去读取 Tensorboard 文件,自己画图了。毕竟总不能直接在网页上截图吧……
Read local tensorflow data
Tensorboard 的文档提供了一种将 Tensorboard 数据转化成 pandas DataFrame 的方式。但是必须要将日志文件上传到他的服务器。文档中还特别描写了读取本地日志的功能还没有实现,以后才会添加:
Note: 1. This API is still in its experimental stage, as reflected by its API namespace. This means the API may be subject to breaking changes in the future. 2. Currently, this feature supports only logdirs uploaded to TensorBoard.dev, a free hosted service for persisting and sharing your TensorBoard. Support for locally stored TensorBoard logdir will be added in the future. Briefly, you can upload a TensorBoard logdir on you local filesystem to TensorBoard.dev with a single line of command:
tensorboard dev upload --logdir <logdir>. See the documentation at tensorboard.dev for more details.
刚看到这个文档觉得有点绝望,经过一番查阅,其实 Tensorboard 是提供了 API 给我们来读本地的日志文件的,只不过不是 DataFrame 的格式而已:
1 | from tensorboard.backend.event_processing.event_accumulator import EventAccumulator |
拿到散点的原始数据,剩下的工作就变成常规的画图了。
Plot with Seaborn
Seaborn 是 Matplotlib 的上层封装,用它画图比直接用 Matplotlib 要简单许多。如果画一条折线图,只需要一行代码就可以实现:
1 | import seaborn as sns |
由于想把多个折线绘制在一个图里方便对比不同算法的效果,就需要封装一个 DataFrame 来传给 Seaborn。
1 | import pandas as pd |
这里使用了 pandas.melt 函数,将不同的数值与名称对应起来。具体可以参考:https://pandas.pydata.org/pandas-docs/stable/reference/api/pandas.melt.html
截图?
刚刚提到“总不能直接去网页上截图吧”,毕竟直接截图不清晰、截取多个图片大小难以保证一致,而且难免会截取到不相关的内容。但其实我们利用网页调试工具,就可以直接把页面元素导出截图。以 Safari 浏览器为例:
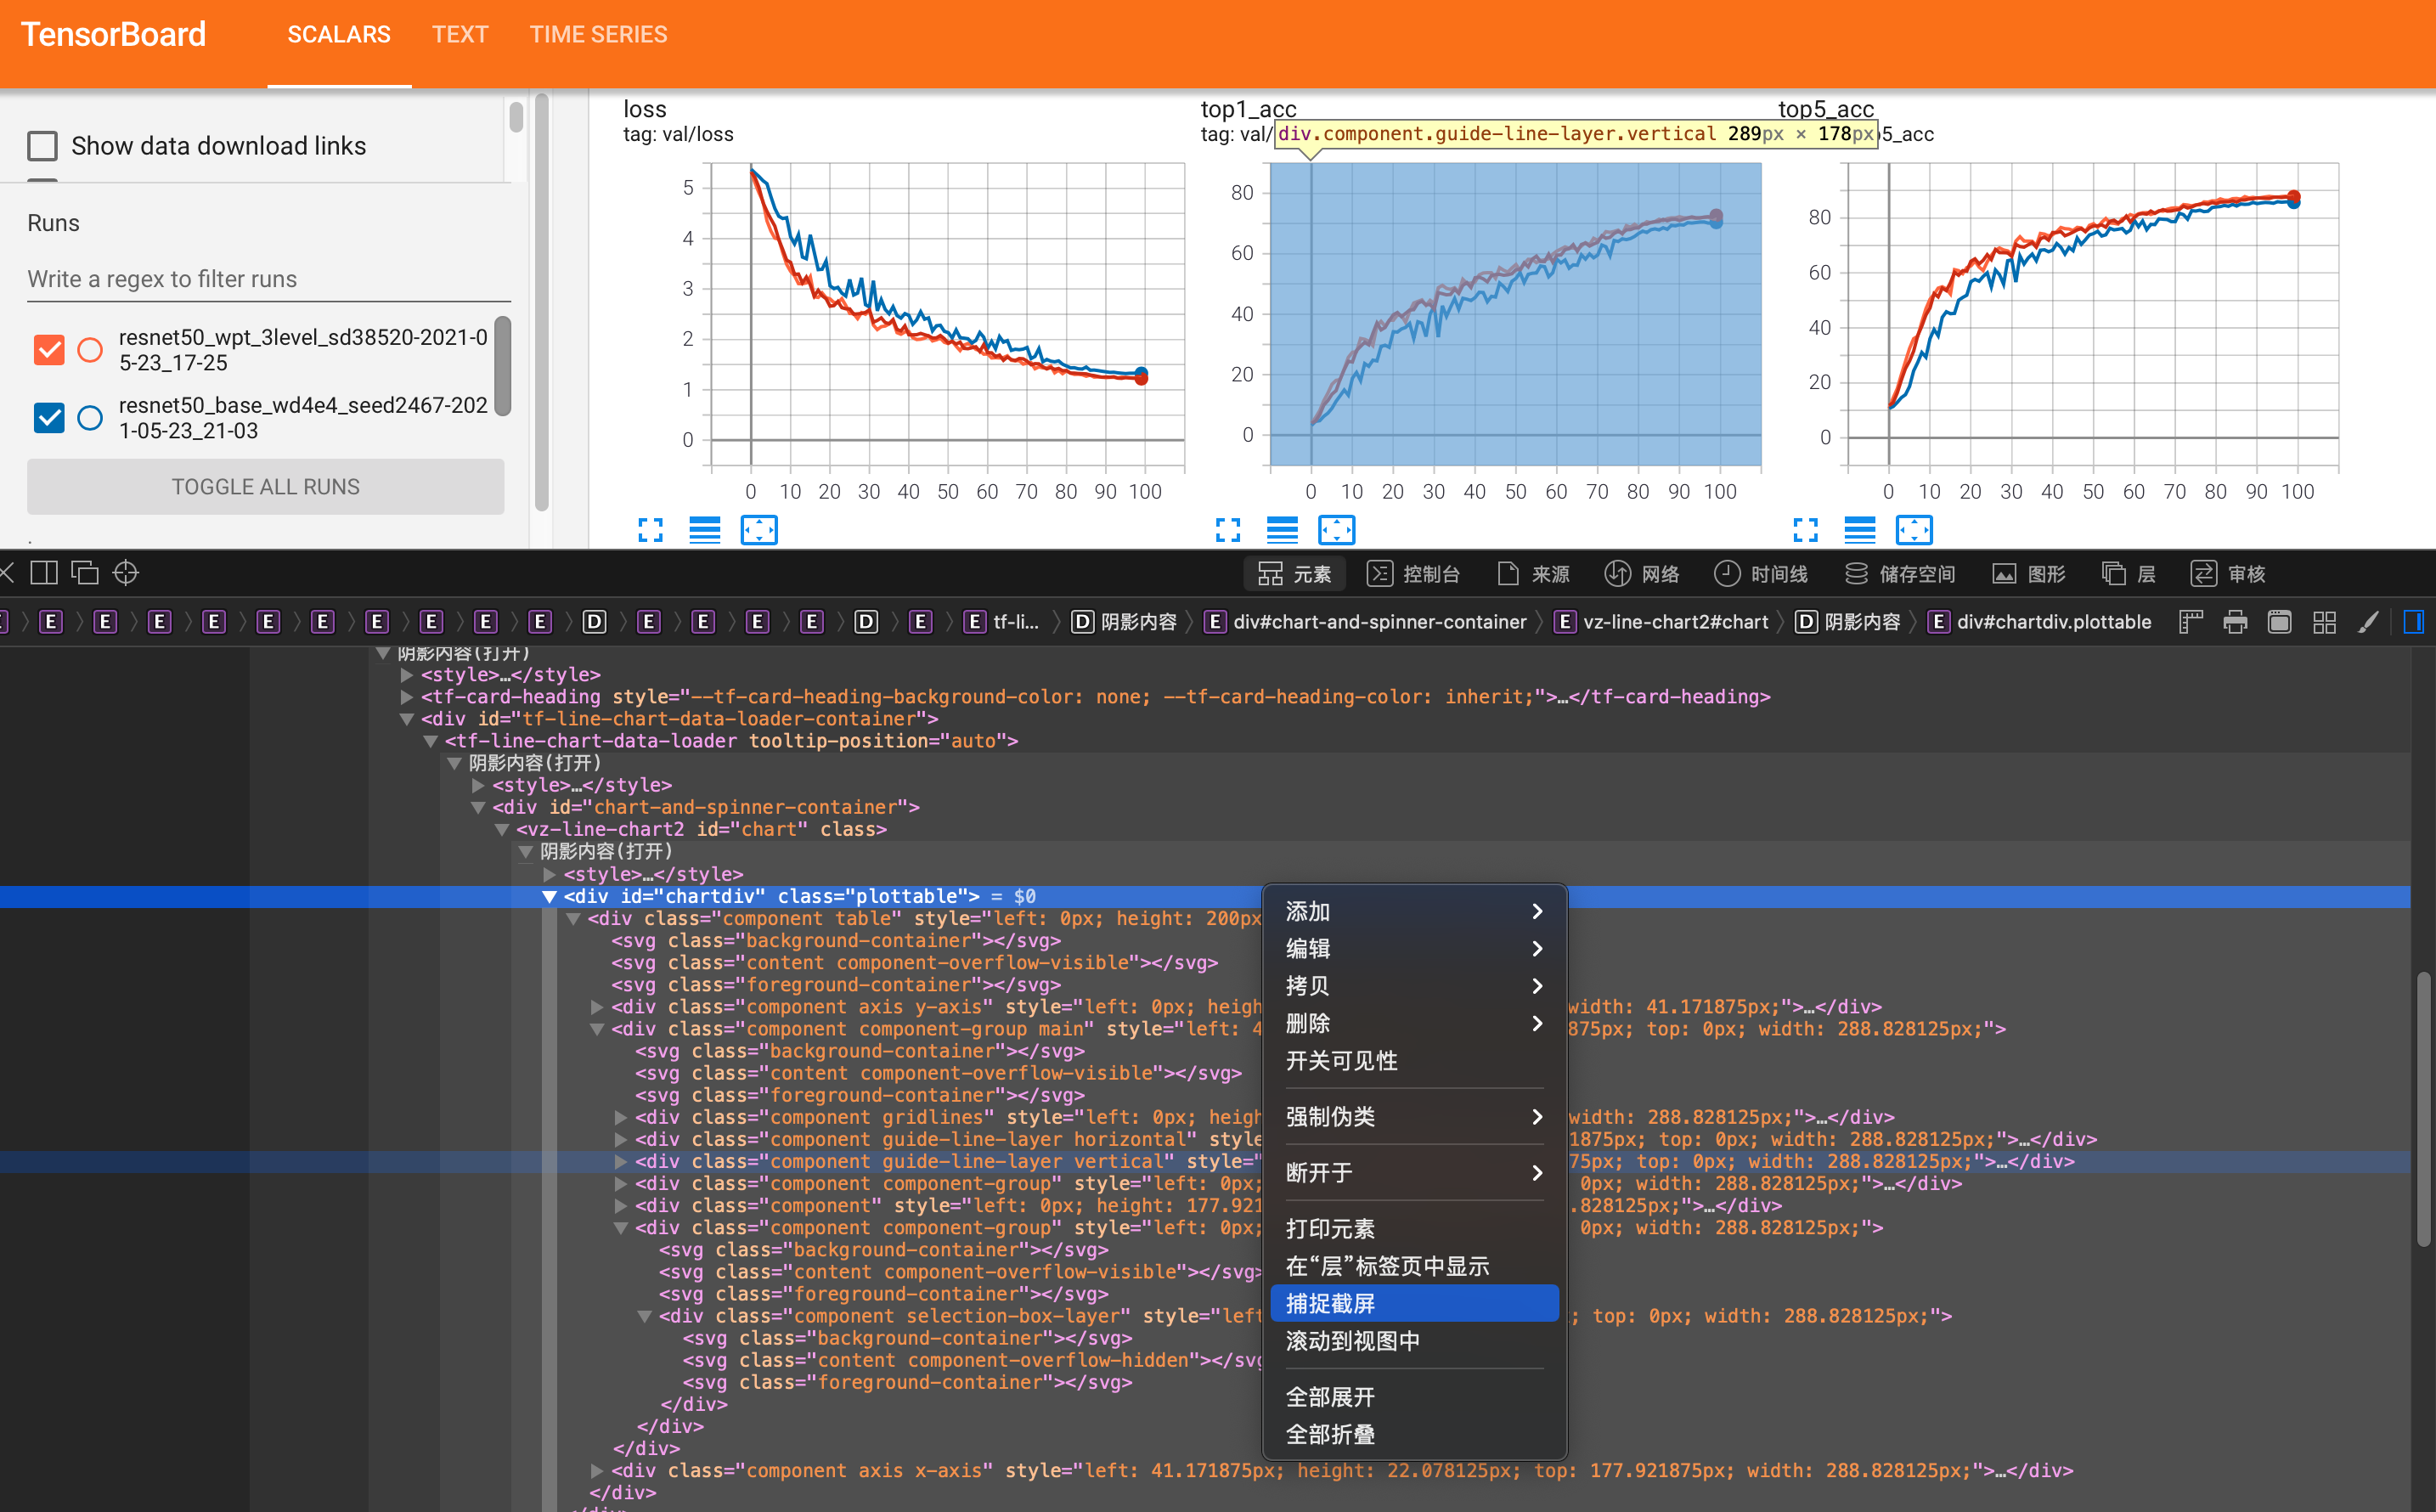
找到对应的元素,直接右键点击捕捉截屏即可。
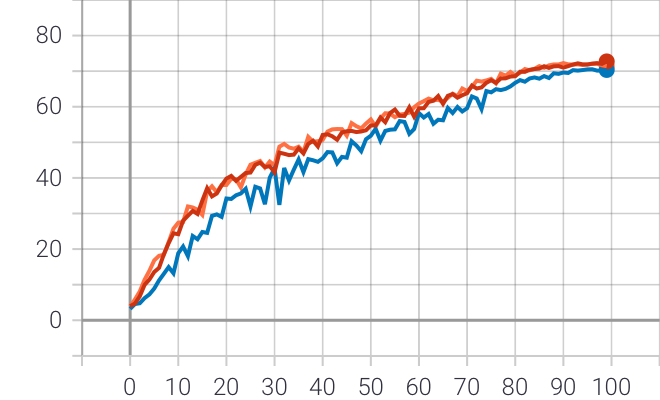
效果还不错,所以截图其实也不是不可以…… 😄